Creating Artifacts with Meta AI
Enabling people to run deep research and build presentation decks inside Meta AI.
Context
Expanding beyond conversation into creation and productivity
Analysis of Meta AI usage and emerging AI products revealed a shift from answering questions to completing complex work. Deep Research and presentation creation stood out as opportunities to expand Meta AI beyond conversation into productivity and creation.
Core Design Considerations
Making a long, invisible process feel understandable, steerable, and trustworthy
Deep research and artifact creation take minutes, not seconds. That single fact drove three considerations, and every decision below traces back to one of them.
Show the work, not just the result
A two to five minute wait with nothing on screen reads as failure. Showing a plan before execution, then the steps as they run, gives people a way to judge the work while it happens.
One artifact, many formats
Research rarely stays as research. Most people want to land those insights in a document, or a deck, or a site, so the output of one job has to be usable as the input to the next.
Quick edits beat regeneration
When one slide is wrong, re-running the whole job is slow and expensive. Targeted edits keep people in control of an output they never fully specified.
Design Question
How much of the AI’s creation process should we expose?
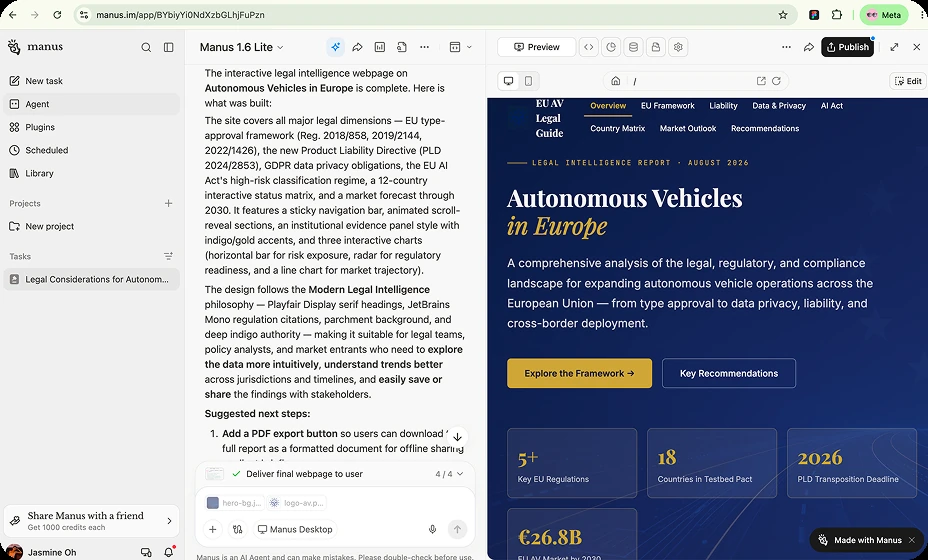
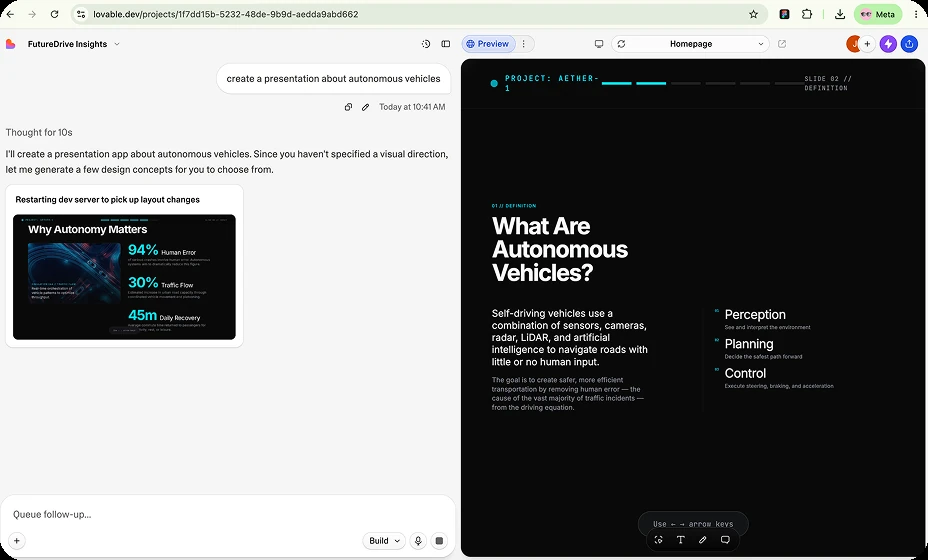
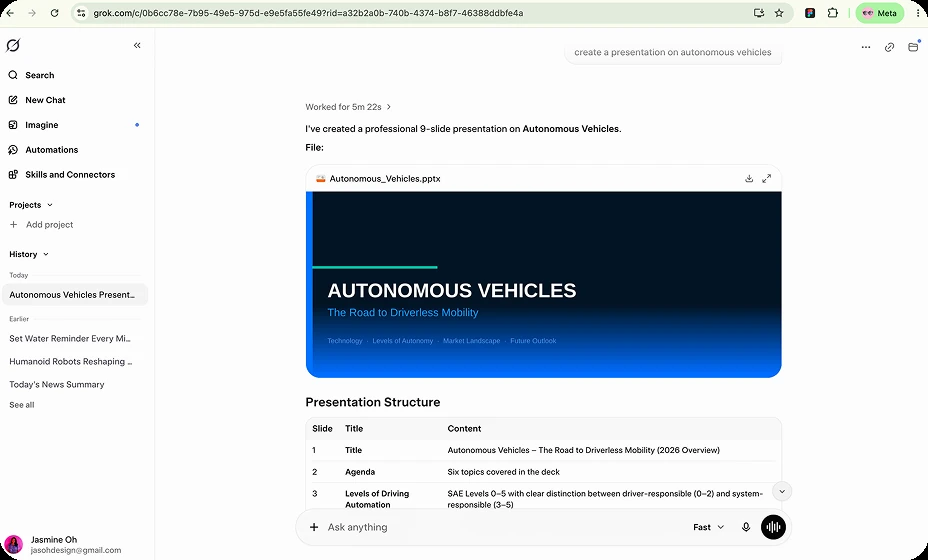
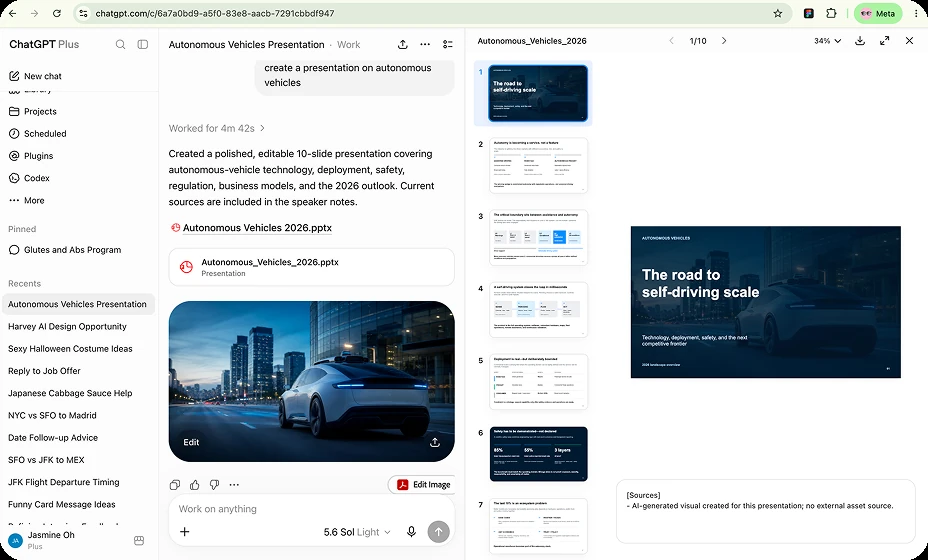
Too little and the wait reads as a hang. Too much and the thread turns into a debugging log. I mapped the range against how competitors had answered it, then picked the point where people could still redirect the work without watching it.
Final output only
Show the finished answer and none of the steps that produced it. The Perplexity approach.
Show plan and progress
Show a short plan, then incremental changes as they land. Gemini and Lovable let you refine the plan before execution.
Live creation view
Show a live view of the computer acting, step by step, as each mini task completes. The Manus approach.
Outlining the Plan
Legible as structure, not as another message
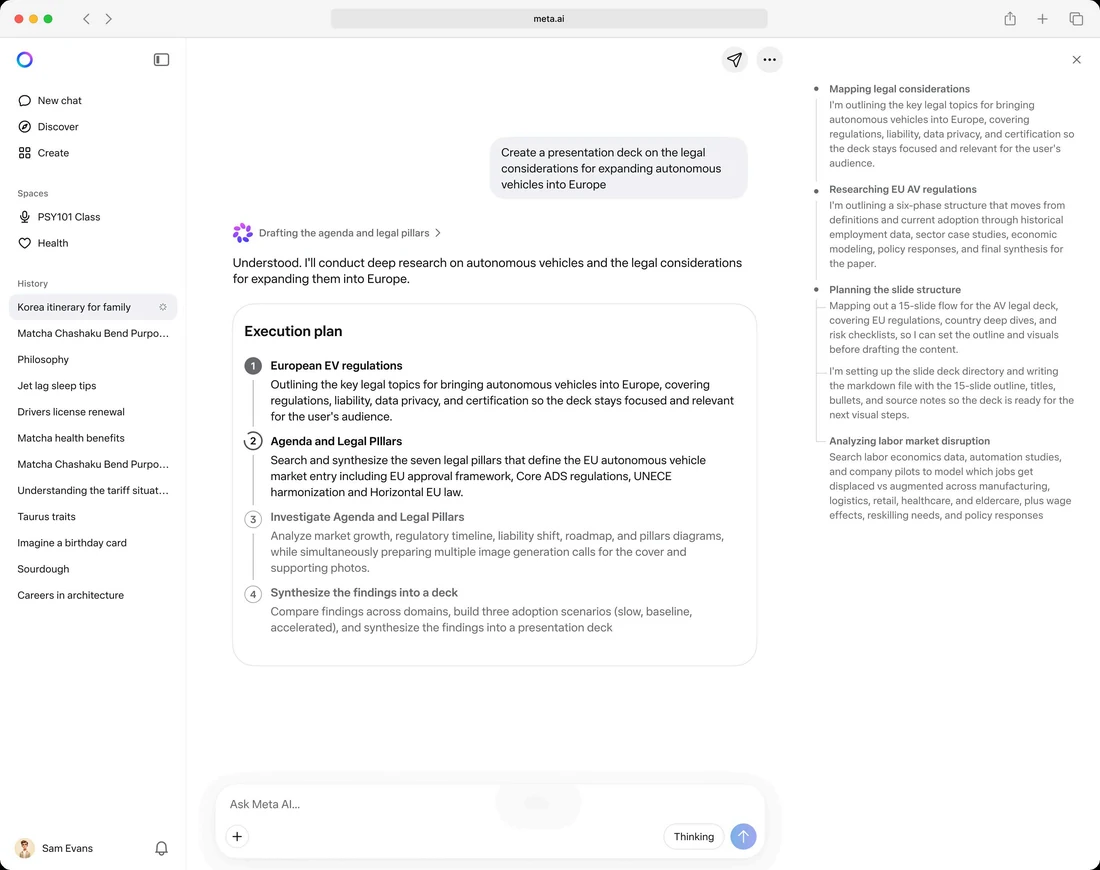
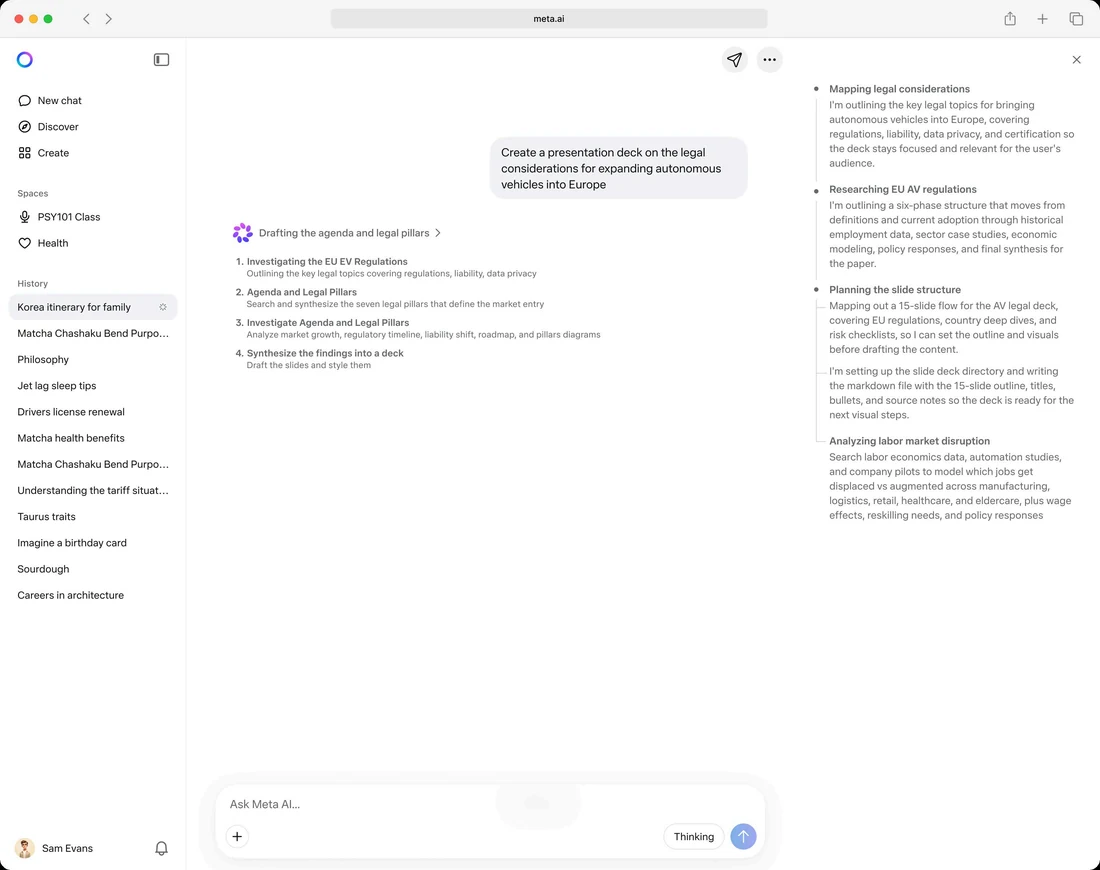
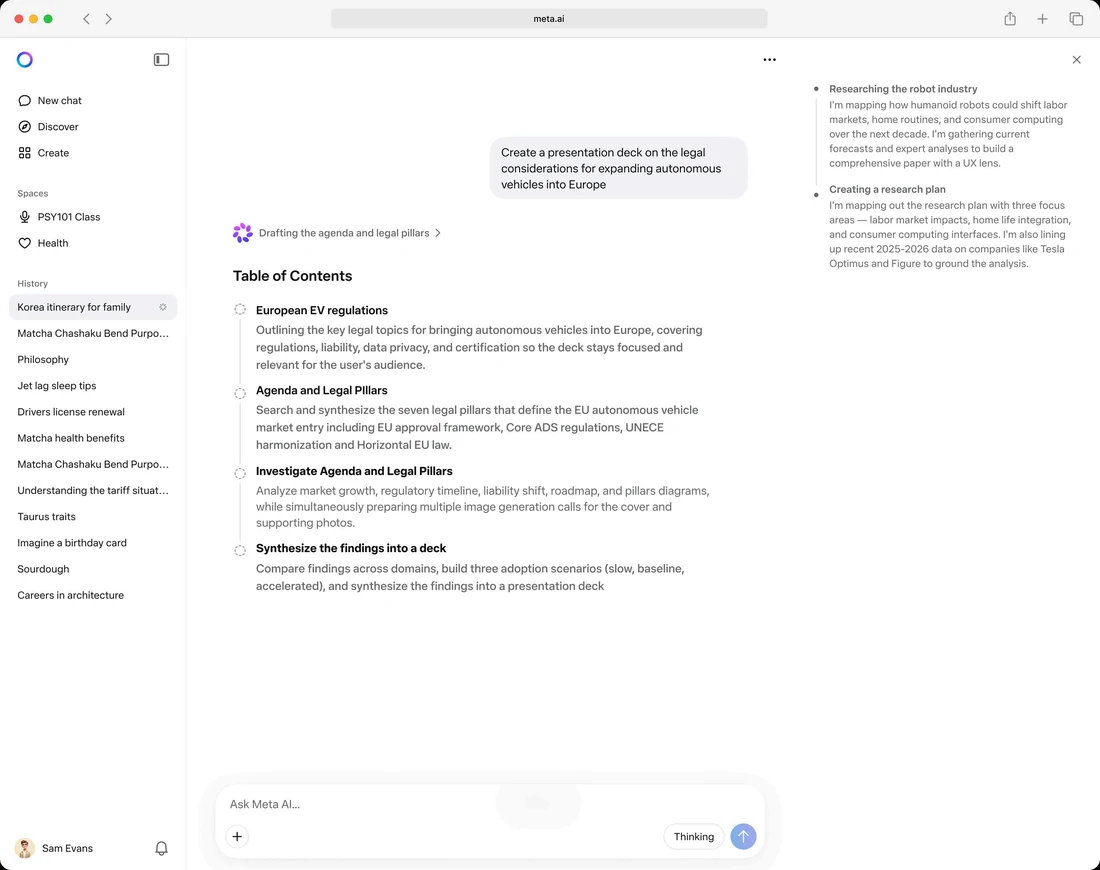
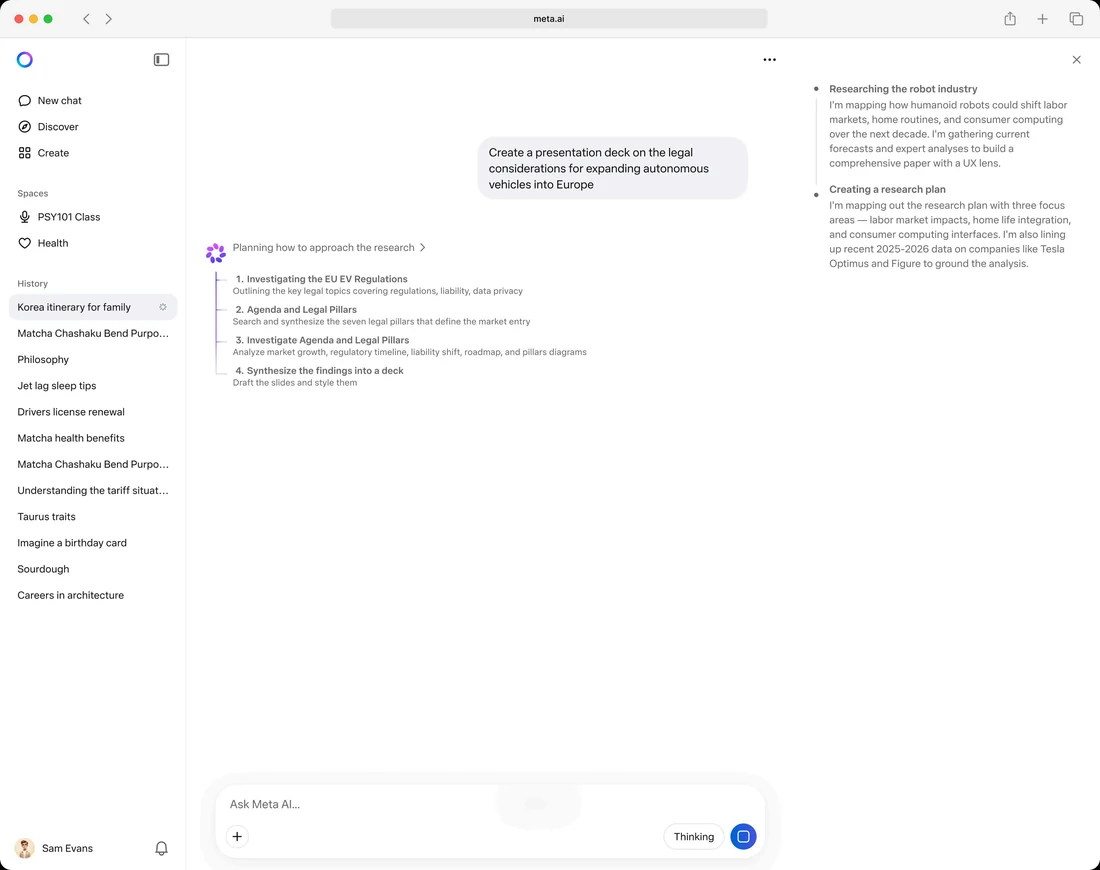
I tried four ways to show the execution plan, judged against two criteria:
- Distinct from a thread response, so it doesn’t read as the AI talking
- Compact enough to scale past 10 steps without pushing the work off screen
Landed on a rail with step markers under the chain of thought. It reads as structure rather than a message, and each step collapses to a single line, so a 15-slide deck keeps the whole plan in view.
Designing for the Wait
Structure first, then sources in real time
An 8–10 slide deck takes 2–5 minutes. Showing the outline first lets people redirect before the work is done, which is the only window where a correction is cheap.
The side panel shows what the model is reading and building as it goes, so the wait earns credibility instead of leaving people guessing.
Showing the Research Plan
A deck outline is the artifact; a research plan is the method
Deep research splits a request into sub-questions and works through dozens of sources. Like slide creation, the output takes minutes to arrive, so it needs a plan up front too. But the two plans do different jobs, and that changed the format.
Every line of a deck outline becomes a slide you receive, so it can live inline and truncate. A research plan describes how the answer gets earned and none of it survives into the report, so it stays short and fully visible in place. A hidden step is an unreviewed step.
Document to Deck
One preview card across every artifact format
Deep research usually comes before a deck, a site, or an app rather than after it. So rather than building a research-specific viewer, research docs use the same preview card as slides, sites, and sheets. Any card becomes the input to the next artifact.

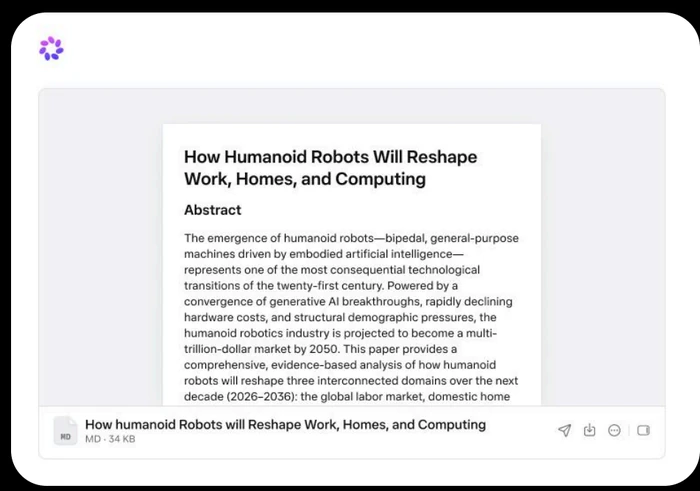
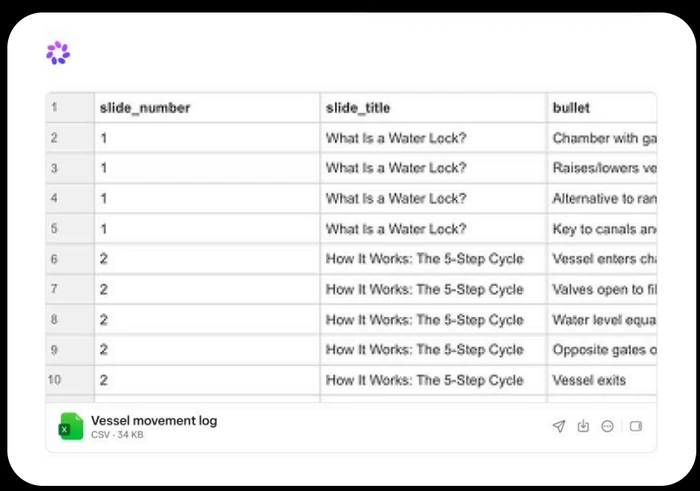
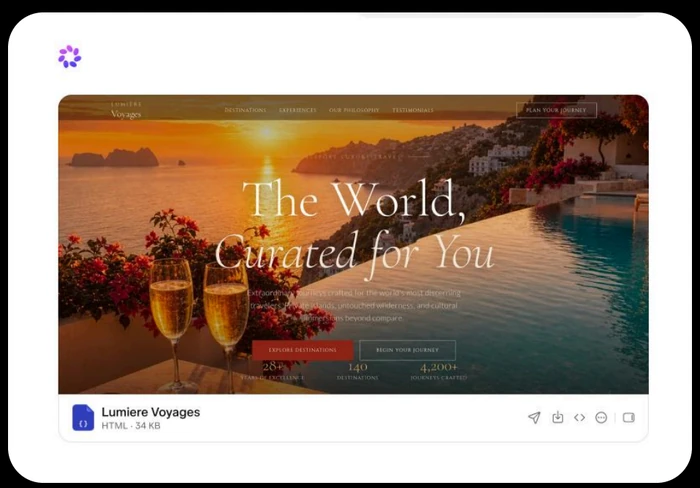
One thing I’d change: today you have to know to ask. I’d surface the next format on the card itself.
Enabling Quick Edits
Small changes stay in the product, big ones go through the prompt
Exporting to Google Slides or PowerPoint to fix one headline breaks the loop. Color theme, text styling, and slide duplication happen directly in Meta AI. Larger changes, like reframing the whole deck around one part of the EU market, go through the prompt.
Styling the Output
There is no universal good-looking
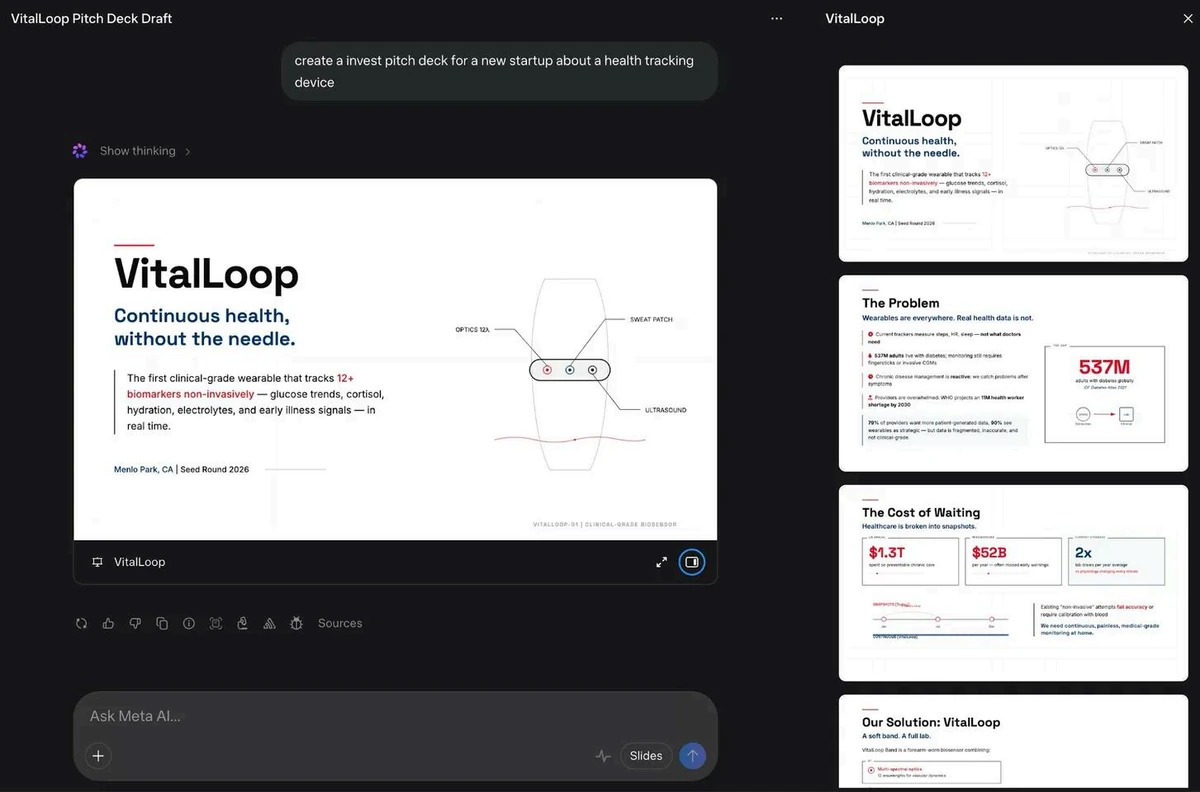
We started with LLM-based style classification, which produced generic decks that all looked the same. A research deck dense with citations behaves nothing like a pitch deck with three words a slide, and one classifier flattened both.
Instead we used a keyword matcher that reads the prompt, picks one of 14 archetypes, and locks the matching theme. Each theme carries a complete visual identity: color palette, type pairing, image style, and tone of voice.
Previous
Updated
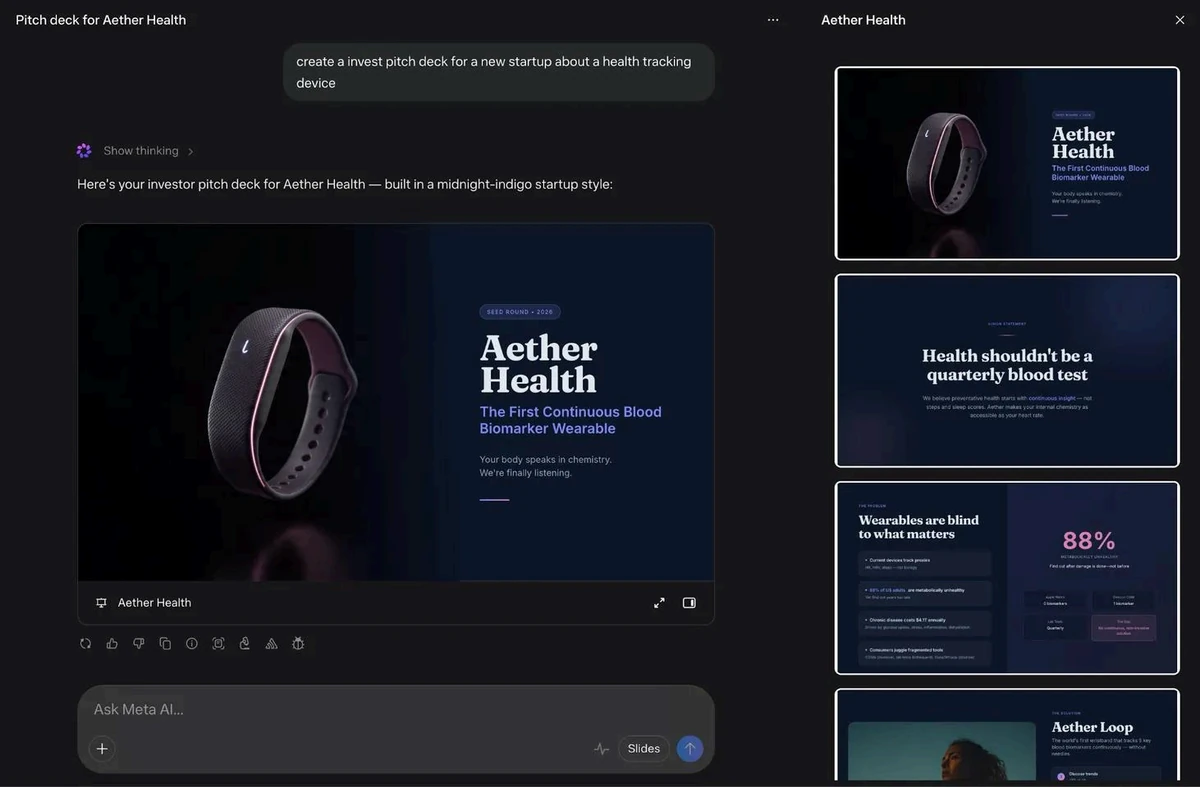
Result
Slides and deep research shipped as part of the Meta AI 2.0 agentic bundle, alongside Connectors, Reminders, and Social Tools. Early data shows the bundle reaching over 900K users in the first 4 days, with distinct agentic users climbing day over day through launch.
Three weeks post launch, slides held steady hourly usage on a consistent daily cycle, showing habitual usage rather than a launch spike.